Demand
Dr. Amy McCormick Diduch
Demand is the relationship between the price of a product offered for sale and the quantity that an individual or group wants to purchase.
Quantity demanded is the quantity of the product that would be purchased at a particular price. Typically, the quantity that an individual desires to purchase decreases as the price of the product increases. This negative relationship between price and quantity demanded is known as the law of demand.
To work with demand curves, you must be able to:
Worked example
Quantity demanded is the quantity of the product that would be purchased at a particular price. Typically, the quantity that an individual desires to purchase decreases as the price of the product increases. This negative relationship between price and quantity demanded is known as the law of demand.
To work with demand curves, you must be able to:
- Calculate market demand from individual demand
- Use a demand schedule (i.e. table of related prices and quantities) to plot a demand curve
- Read from a demand curve the quantity demanded at a given price
- Show how the position of the demand curve changes when one of the underlying determinants of demand changes.
Worked example
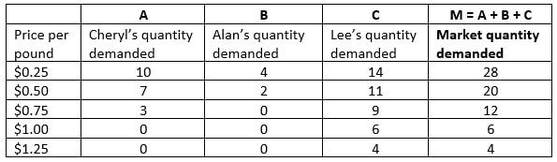
- From individual demand schedules to a market demand schedule
2. From a market demand schedule to a demand curve.
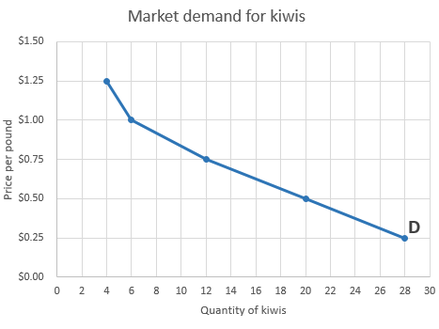
The demand curve illustrates the relationship between price and quantity demanded. By convention we put price on the vertical axis and quantity demanded on the horizontal axis. This graph shows that at a price of $1.25 per pound, 4 kiwis are demanded while at a price of $0.25 per pound, 28 kiwis are demanded (as presented in the market demand schedule in the table above).
This demand curve allows us to ask what happens when the price of kiwis changes. Suppose the current price is $0.75 and quantity demanded is 12. If the price increases to $1.00, quantity demanded will fall to 6. If the price instead falls to $0.50, quantity demanded will increase to 20.
3. Determinants of demand:
This specific market demand curve for kiwis is based on an assumption of “ceteris paribus,” or “all other things held constant.” It freezes (for the moment) people’s preferences, incomes, and prices of other purchasing alternatives. However, demand is not constant! People change their desired quantity demanded all the time. We need to be able to predict when and why demand will change.
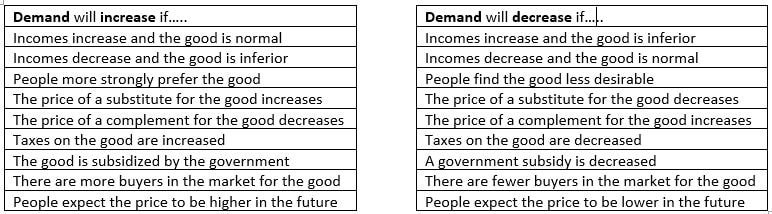
In general, the demand relationship for a product will shift if any of the following factors changes:
This specific market demand curve for kiwis is based on an assumption of “ceteris paribus,” or “all other things held constant.” It freezes (for the moment) people’s preferences, incomes, and prices of other purchasing alternatives. However, demand is not constant! People change their desired quantity demanded all the time. We need to be able to predict when and why demand will change.
In general, the demand relationship for a product will shift if any of the following factors changes:
- Incomes
- An increase in income will lead to an increase in demand for some goods and services. We term these normal goods.
- However, an increase in income will lead to a decrease in demand for other goods and services (because people will use their new spending power to buy goods that they like better but could not previously afford). We refer to these as inferior goods.
- To correctly predict what happens to demand when income increases, we need to specify whether the good is normal or inferior. Without this qualification, our prediction isn't useful.
- Preferences
- Prices of related goods (i.e. substitutes and complements)
- Demand for a good will increase when a substitute good increases in price. (Substitutes are goods that are used in place of each other, such as one brand of shampoo for another brand).
- Demand for a good will decrease when a complementary good increases in price. (Complements are goods that are used with each other, such as shampoo and conditioner).
- Taxes or subsidies
- Placing a tax on a good reduces demand for the product
- Providing a subsidy for a good increases demand for the product
- The number of buyers in the market for the good
- Expectations about future prices
- If people expect prices to be higher next week, demand increases today.
- If people expect prices to be lower next week, demand decreases today.
Using the model of demand:
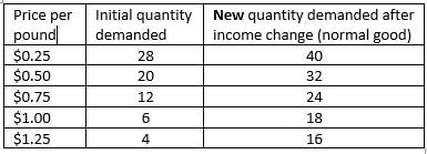
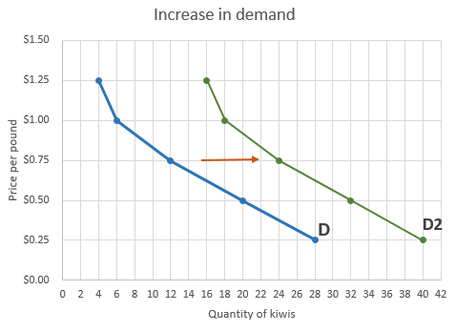
Suppose incomes increase and kiwis are a “normal” good. How does this affect demand for kiwis? The demand schedule below shows the market quantity demanded at any price before and after the increase in incomes.
Suppose incomes increase and kiwis are a “normal” good. How does this affect demand for kiwis? The demand schedule below shows the market quantity demanded at any price before and after the increase in incomes.
The graph demonstrating this increase in demand (below) has the following characteristics:
- The axes are labeled (price and quantity)
- The original demand curve and the new demand curve are both clearly labelled and an arrow shows the direction of the shift
- The new demand curve shows that at any price, the quantity demanded is now larger than it previously was. For example, at a price of $0.75, the new quantity demanded is 24. Before the change in incomes, only 12 kiwis were demanded at a price of $0.75.
Relationship graphs without the numbers
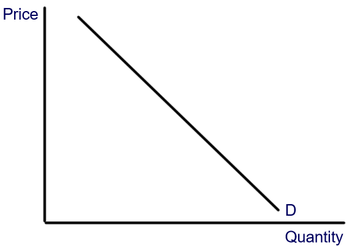
You don’t need the entire schedule of prices and quantities demanded to illustrate the demand relationship or to show the impact of a change in incomes, preferences, or related goods prices on that relationship. The law of demand tells us there is a negative relationship between price and quantity demanded for most goods and services. Thus, a typical demand curve sketch looks like this:
You don’t need the entire schedule of prices and quantities demanded to illustrate the demand relationship or to show the impact of a change in incomes, preferences, or related goods prices on that relationship. The law of demand tells us there is a negative relationship between price and quantity demanded for most goods and services. Thus, a typical demand curve sketch looks like this:
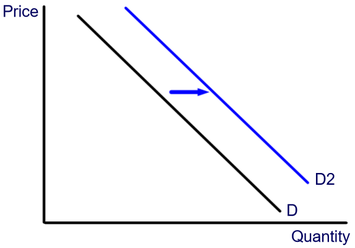
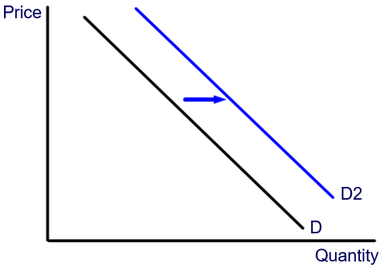
Suppose the price of a substitute for kiwi fruit increases (for example, mangoes are now twice as expensive). Our theory of demand tells us that when the price of a substitute for kiwis increases, the demand for kiwis will increase at any price. We show this as a rightward shift of the demand curve for kiwis
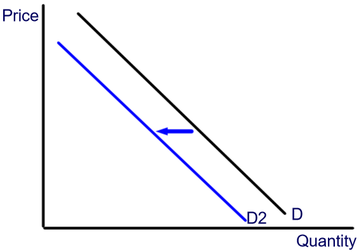
Suppose, instead, we are interested in the market for pineapples. Assume that most people consume pineapples and coconuts together in a tropical drink (i.e. pineapples and coconuts are complements). The price of coconuts increases. Will this affect the market for pineapples? If the price of a complement (like coconut) increases, people will consume fewer pineapples at any price. The demand curve will shift to the left:
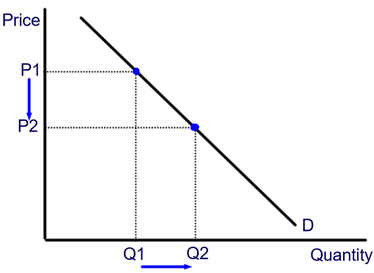
Suppose there is a sale on pineapples at the grocery store this week (in other words, the price of pineapples decreases from P1 to P2). What happens to the demand for pineapples? Answer: nothing happens to demand, i.e. the position of the demand curve does not shift. Instead, people choose a different quantity demanded at the new (lower) price. (Quantity demanded increases from Q1 to Q1). We refer to this as a movement along the demand curve.
Suppose news headlines proclaim pineapples to be a health miracle that will extend your life by two years. What would happen to the demand for pineapples? We predict this news would change peoples’ preferences for pineapples and cause an increase in demand. The demand curve shifts to the right:
Suppose people expect a big sale on pineapples next week. They may decide to postpone their pineapple purchases. As a result, demand for pineapples decreases this week and the demand curve shifts to the left.

Click on the file below to download practice problems (with answers)
| practice_problems_with_demand_curves.pdf |
Prefer to see these concepts demonstrated step-by-step? The videos below cover the same material:
