Comparative Statics
Dr. Amy McCormick Diduch
When we sketch a graph of market equilibrium price and quantity (with an upward-sloping supply curve and downward-sloping demand curve), we are implicitly assuming that we have accounted for all relevant factors in the market: people’s preferences and incomes, costs of production, or level of technology. We now need to understand how to adjust our model if one of these determinants of supply or demand changes.
“Comparative statics” begins with an initial graph of a market in equilibrium. Something – a supply or demand determinant – changes; we illustrate the new position of the relevant curve and observe what happens to the price of the product and the quantity exchanged. You will want to pay close attention to the typical determinants of supply and demand (covered in previous tutorials).
As an example, let’s look at how to analyze what happens in the market for home exercise machines when a new study is published detailing the health benefits of exercise.
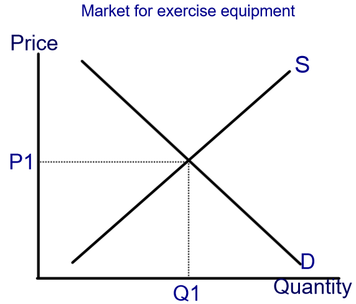
1. Start by sketching the market in equilibrium. First, draw the axes for the graph. Label the vertical axis “Price” and label the horizontal axis “Quantity.” Draw and label the demand curv e (remember: it always slopes downward). Draw and label the supply curve (remember: it always slopes upward). Mark the equilibrium values for price and quantity on the axes. Give a descriptive title to your graph (“Market for home exercise equipment”)
Dr. Amy McCormick Diduch
When we sketch a graph of market equilibrium price and quantity (with an upward-sloping supply curve and downward-sloping demand curve), we are implicitly assuming that we have accounted for all relevant factors in the market: people’s preferences and incomes, costs of production, or level of technology. We now need to understand how to adjust our model if one of these determinants of supply or demand changes.
“Comparative statics” begins with an initial graph of a market in equilibrium. Something – a supply or demand determinant – changes; we illustrate the new position of the relevant curve and observe what happens to the price of the product and the quantity exchanged. You will want to pay close attention to the typical determinants of supply and demand (covered in previous tutorials).
As an example, let’s look at how to analyze what happens in the market for home exercise machines when a new study is published detailing the health benefits of exercise.
1. Start by sketching the market in equilibrium. First, draw the axes for the graph. Label the vertical axis “Price” and label the horizontal axis “Quantity.” Draw and label the demand curv e (remember: it always slopes downward). Draw and label the supply curve (remember: it always slopes upward). Mark the equilibrium values for price and quantity on the axes. Give a descriptive title to your graph (“Market for home exercise equipment”)
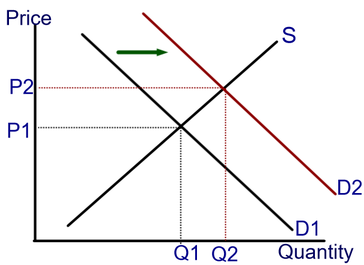
2. Now you have to decide how the news about exercise will affect the market for home exercise equipment. You decide that the news will affect people’s tastes for exercise: many people will decide they need to exercise more and many of them will now decide to buy home exercise equipment. This will show up in the market as an increase in demand — more people will now buy the equipment at any price than did so before the news became public. To show this on your graph, you need to sketch a new demand curve above and to the right of the old demand curve. Mark the new price and the new quantity.
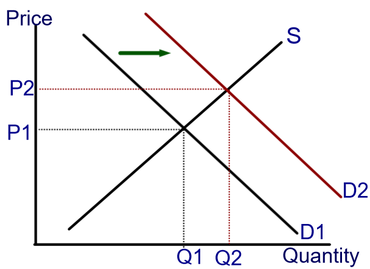
3. Finally, make a note next to your graph to describe what has happened in this market. This note should include (a) which determinant of supply or demand changed, (b) the direction a curve shifts and (c) the impact of the change on equilibrium price and quantity. For example:
Increase in preferences for exercise equipment --> increase in demand for exercise equipment -->
Increase in price and quantity for equipment
Comparative statics examples
What is the likely effect of a recession on the market for Greyhound bus rides?
Increase in preferences for exercise equipment --> increase in demand for exercise equipment -->
Increase in price and quantity for equipment
Comparative statics examples
What is the likely effect of a recession on the market for Greyhound bus rides?
- Bus rides are probably an inferior good for most people.
- ↓income = ↑ demand for inferior good
- increase in price, increase in quantity in equilibrium
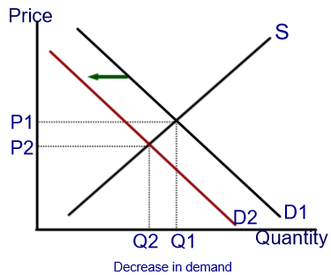
What is the likely effect of a recession on the market for cell phones?
- Cell phones are normal goods.
- ↓income = ↓demand for normal goods
- decrease in price, decrease in quantity in equilibrium
Suppose there is a technological improvement in our ability to manufacture cell phones. How does this affect the market for cell phones?
- ↑technology
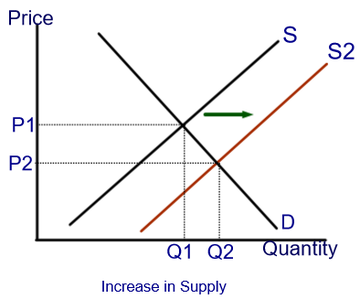
- ↑supply of cell phones
- decrease in equilibrium price and increase in equilibrium quantity of cell phones
Suppose a severe drought hit the sugarcane crop. Predict how this would affect the equilibrium price and quantity in the market for refined sugar and the market for honey.
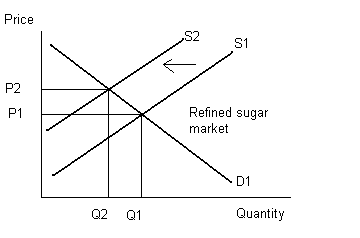
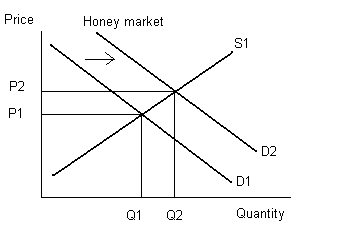
Explanation: the drought causes the supply of sugarcane (an input to refined sugar production) to decrease and the price of sugarcane to increase. With the increase in input price, the supply of refined sugar will decrease, resulting in an increase in price and decrease in quantity of refined sugar. Honey is a substitute for refined sugar. When the price of refined sugar increases, the demand for honey will increase. This leads to an increase in price and increase in quantity of honey.
In summary form,
What if both supply and demand shift?
Supply and demand factors may change simultaneously. For example, suppose we are analyzing the market for gasoline. Assume the current equilibrium price is $2.50 per gallon. Two things happen: technological improvements are adopted in the U.S. oil industry and incomes are rising, allowing people to enjoy more travel. What happens to the price and quantity of gasoline?
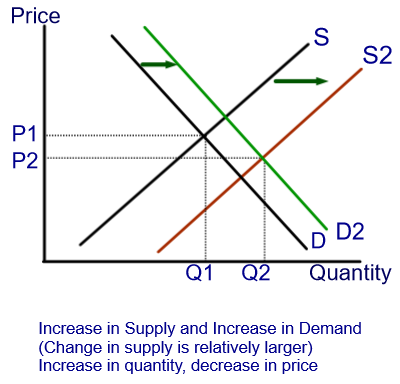
The answer depends on the relative sizes of the supply and demand shifts. Technological improvements cause an increase in supply. Rising incomes (gasoline is a normal good) cause an increase in demand. Thus we know we have to shift both of our curves to the right.
Suppose the shift in the supply curve is larger than the shift in the demand curve. The graph at right shows the impact of this change. The equilibrium market quantity of gasoline will increase and the price will fall.
In summary form,
- ↑ input price à (b) decrease in supply of refined sugar à (c ) increase in equilibrium price, decrease in equilibrium quantity of refined sugar
- ↑ price of refined sugar = increase price of substitute for honey à (b) increase in demand for honey à (c ) increase in equilibrium price and increase in equilibrium quantity of honey
What if both supply and demand shift?
Supply and demand factors may change simultaneously. For example, suppose we are analyzing the market for gasoline. Assume the current equilibrium price is $2.50 per gallon. Two things happen: technological improvements are adopted in the U.S. oil industry and incomes are rising, allowing people to enjoy more travel. What happens to the price and quantity of gasoline?
The answer depends on the relative sizes of the supply and demand shifts. Technological improvements cause an increase in supply. Rising incomes (gasoline is a normal good) cause an increase in demand. Thus we know we have to shift both of our curves to the right.
Suppose the shift in the supply curve is larger than the shift in the demand curve. The graph at right shows the impact of this change. The equilibrium market quantity of gasoline will increase and the price will fall.
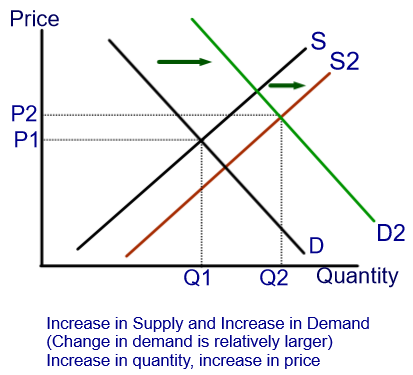
What happens if the shift in demand is relatively larger than the shift in supply?
When the shift in demand is relatively larger, the result is an increase in the market equilibrium quantity but an increase in the price.
When the shift in demand is relatively larger, the result is an increase in the market equilibrium quantity but an increase in the price.
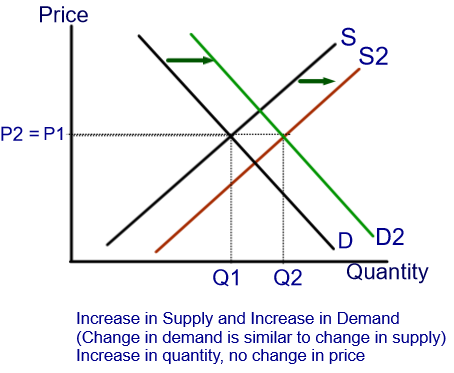
Finally, what happens if the shifts in supply and demand are relatively equal in size?
In this case, market equilibrium quantity increases but the price remains the same.
In this case, market equilibrium quantity increases but the price remains the same.
Notice that in all three of our examples, the market quantity increases! Thus we can confidently predict that when both supply and demand increase, the quantity exchanged will also increase. Why? Taken individually, both an increase in demand and an increase in supply result in higher equilibrium quantities.
However, price may increase, decrease or remain constant as a result of increases in both supply and demand. Why? Taken individually, an increase in supply would decrease the equilibrium price but an increase in demand would increase the equilibrium price. Taken together, we cannot predict the exact effect unless we have information about the relative sizes of the changes.
Try the practice problems in the file below to get comfortable with comparative statics using supply and demand curves.
| practice_problems_with_comparative_statics.pdf |
|
Prefer to see these concepts demonstrated step-by-step? These videos provide examples and practice problems. |
|
|
